| Ch 2. Particle Force and Acceleration | Multimedia Engineering Dynamics | ||||||
|
Rect. Coord. |
Normal/Tang. Coord. |
Polar Coord. |
Orbital Mechanics | Computational Mechanics | |||
| Computational Mechanics | Case Intro | Theory | Case Solution |
| Chapter |
| - Particle - |
| 1. General Motion |
| 2. Force & Accel. |
| 3. Energy |
| 4. Momentum |
| - Rigid Body - |
| 5. General Motion |
| 6. Force & Accel. |
| 7. Energy |
| 8. Momentum |
| 9. 3-D Motion |
| 10. Vibrations |
| Appendix |
| Basic Math |
| Units |
| Basic Dynamics Eqs |
| Sections |
| eBooks |
| Dynamics |
| Fluids |
| Math |
| Mechanics |
| Statics |
| Thermodynamics |
| ©Kurt Gramoll |
|
|
||
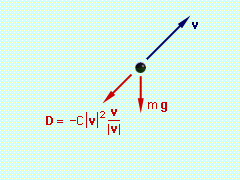
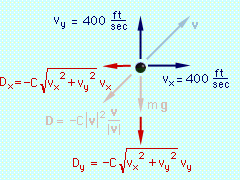
 Force Diagram - Vectors  Force Diagram - Components |
Begin with a free-body diagram. The velocity has been included on the free-body diagram for reference. To apply Eqs. 5, the x and y components of the total
force on the projectile must be determined. Since v/|v|
is a unit vector, D can be written as
The external forces are weight and drag, The x and y components of the total force are Now, consider the case when C = 0.002, and let Δt = 0.1. At the initial time to to = 0 vx(to) = 400 ft/s vy(to)
= 400 ft/s Using the four basic equations for position and velocity (Eqs. 5) the
following is determined, y - position |
|
|
|
||
|
x
- velocity x
- velocity |
||
|
|
Continuing this way, the results for the first five time-steps can be obtained as shown in the table at the left. These values can then be plotted to obtain an approximate solution for the trajectory of the projectile: When there is no drag (C = 0), the closed-form solution for the trajectory can be obtained and compared with the numerical solution. The graph below presents this comparison using Δt = 3.5s, Δt = 1.0s, and Δt = 0.1s. Notice that the numerical solution with Δt = 0.1s is the closest to the exact solution. This indicates that as the time-step is decreased, the numerical solution becomes more accurate.
|
|
 |
||


